MGT
AboutProjectsCVWritingContact
let's work together

Writing

  • 14 October 2026Cutting my RAG assistant's first word from 50 seconds to 4The first version of the RAG assistant I built for my portfolio kept visitors waiting 25–50 seconds before an answer began. What I measured, what I kept on my server and what I moved to the cloud, and what that decision cost.→
  • 14 October 2026Connecting an AI bot to a production database: three layers of read-onlyA support bot had to read live MySQL without ever writing a single row. Why I built three layers instead of trusting one safeguard, and how I masked sensitive data before it could ever reach the logs.→

© 2026 Muhammed Göktuğ Temiz

Next.js · Tailwind · self-hosted

04 / 07Monitoring & Observability Infrastructure

Project 4 of 7

Monitoring & Observability Infrastructure

Server, service and application — all on the same screen.

A monitoring and alerting layer built with Zabbix, Prometheus and Grafana, plus virtual machine and container management on Proxmox.

Role
AI Engineer · Telpass İletişim
Period
2026 — Present

Stack

  • Zabbix
  • Prometheus
  • Grafana
  • Proxmox VE
  • ELK Stack
  • Linux

Problem

Learning that a service is down from a customer is a process failure more than a technical one. When server, application and service layers are monitored separately, working out whether a slowdown comes from disk, from a query or from an external API means digging by hand every single time.

Solution

I brought infrastructure, application and service metrics together into one observability layer:

  • Zabbix — server and network level monitoring, hardware and service state
  • Prometheus — application and service metrics collected as time series
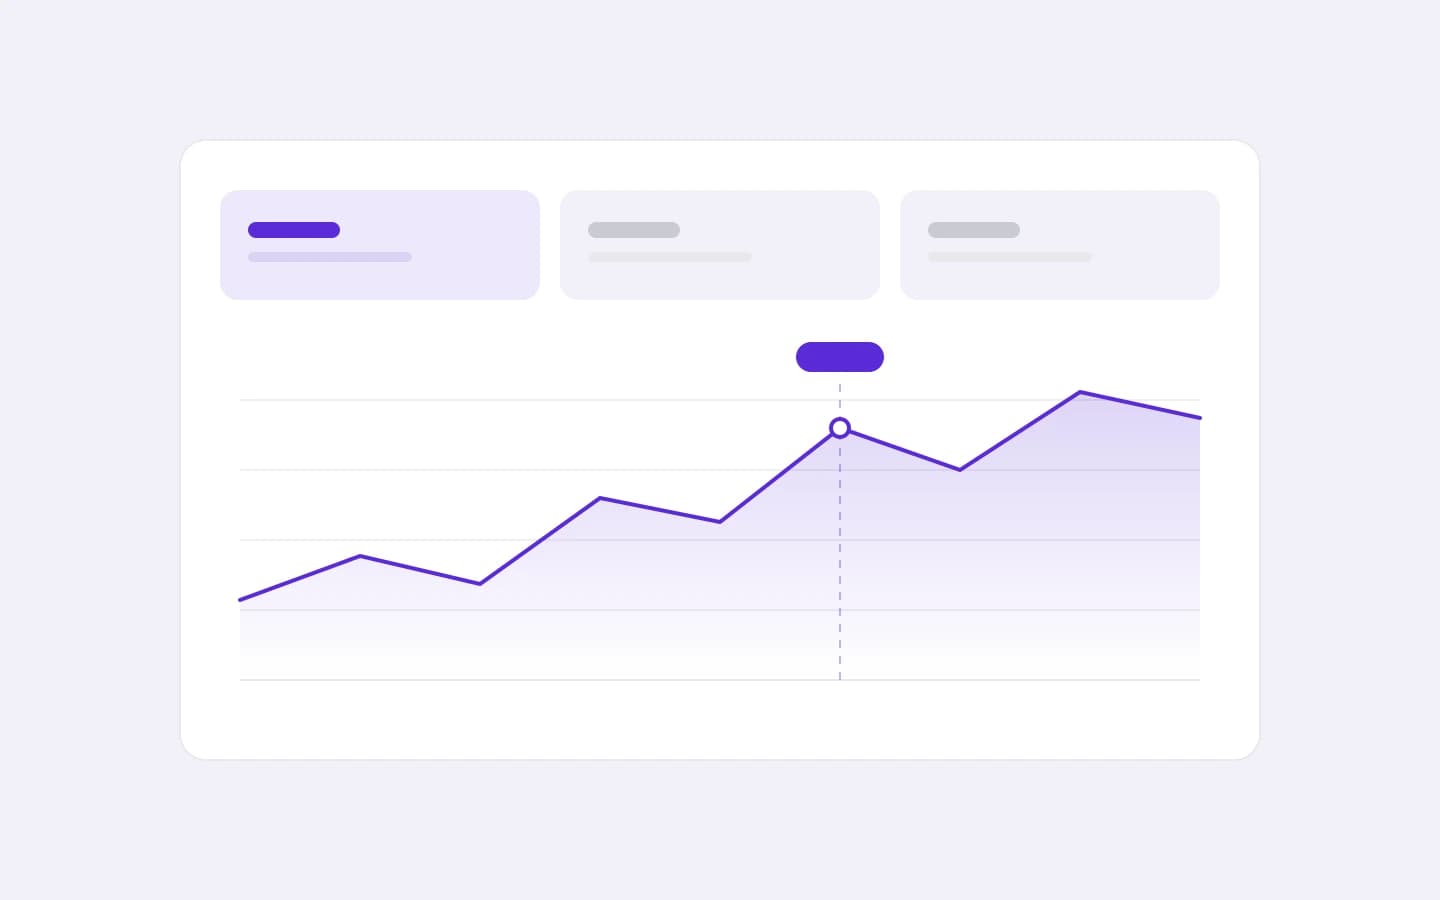
  • Grafana — dashboards that join both sources and allow visual correlation
  • ELK Stack — log collection, search and error analysis

On top of that I wrote the alerting rules: threshold breaches, service outages and abnormal latencies are pushed to the right channel automatically.

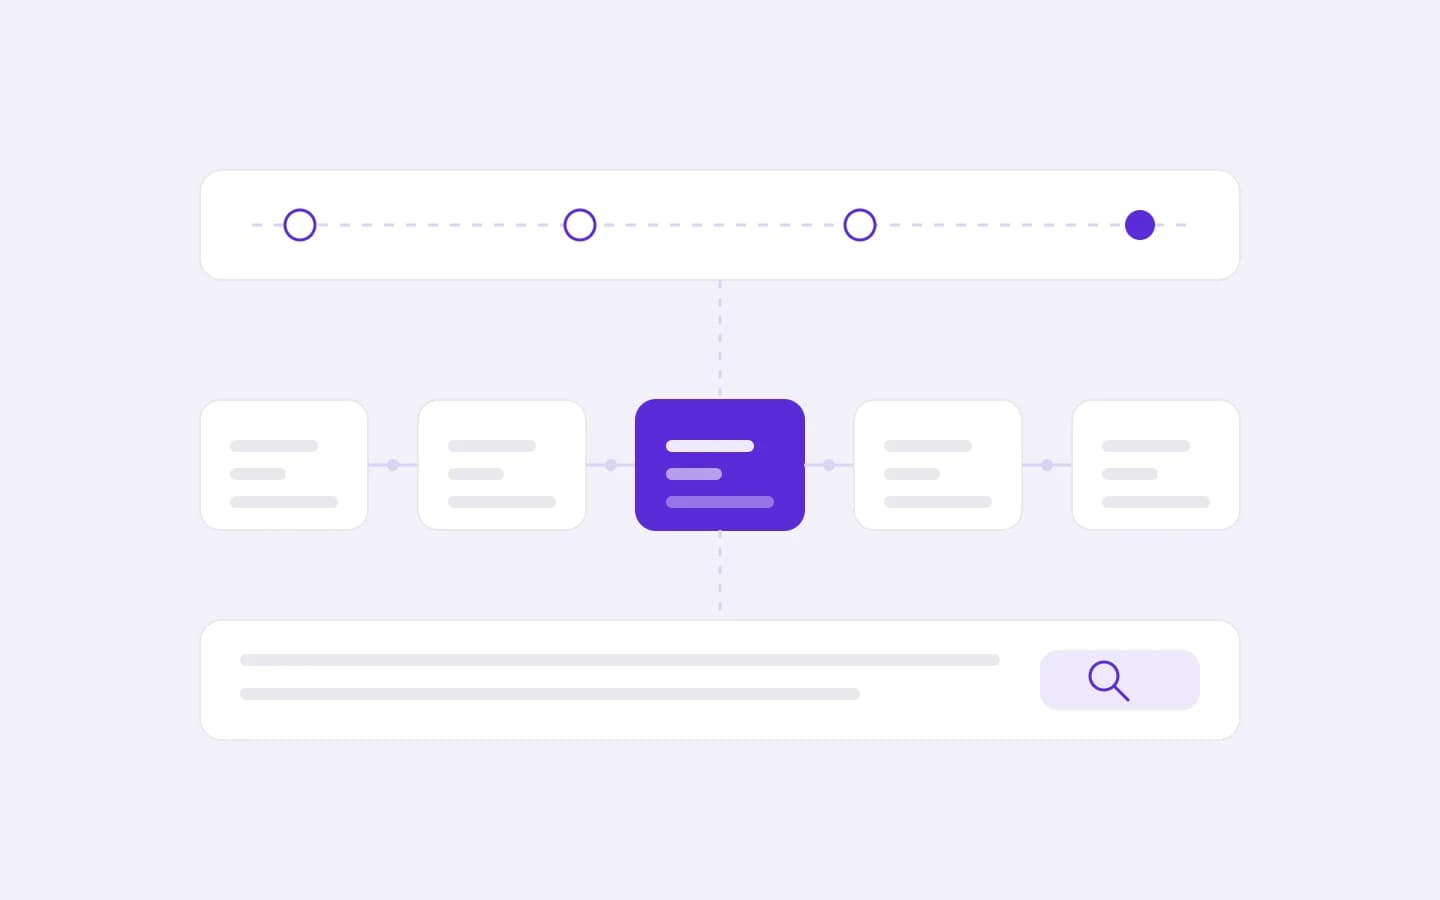
Monitoring layers
  1. Grafana dashboardsZabbix and Prometheus on one screen; built around questions, not metrics
  2. ZabbixServers, network and hardware (agent)PrometheusApplication and service metrics (pull)ELK StackLog collection, search and error analysis
  3. ProxmoxServices in VMs and containers; snapshots and backups

Alerts: only actionable situations (threshold breaches, service outages, abnormal latency) reach the relevant channel.

Architectural decisions

Two collectors, used together on purpose. Zabbix is agent-based and mature on the infrastructure side; Prometheus, with its pull model, fits application metrics better. Rather than forcing both jobs onto one tool, I left each where it is strongest and delegated the joining to Grafana.

Dashboards were designed around questions, not metrics. Instead of "what is CPU doing", I built panels that answer "is this service healthy right now, and if not, where is it stuck". The screen someone on call looks at in the first 30 seconds has to point them in a direction without digging.

Alert noise was capped from the start. Setting an alarm on every metric means, after a while, that no alarm gets read. Only actionable conditions raise an alert; everything else stays on a dashboard.

Virtualisation on Proxmox. Services are split across VMs and containers, with resource isolation, snapshots and backups managed from that layer. The backup and system continuity plan was built on top of the same structure.

Outcome

Problems are discovered from alerts rather than from customers. Which layer a slowdown comes from is visible on a single Grafana board, and post-incident review can put logs and metrics side by side.

Next projectAveris Soft — Freelance Web & Software Work→

AI Engineer · Computer Engineer

MuhammedGöktuğ Temiz

I build products where AI meets data systems.

Computer engineer working on AI-driven systems, data pipelines and system integrations. I design automation-oriented, scalable structures that turn complex raw data into something meaningful and usable.

See my workGet in touch
Location
Başakşehir / İstanbul, Türkiye
selected projects
7
Muhammed Göktuğ TemizOpen to new projects

About

As an AI Engineer with a degree in Computer Engineering, I build LLM-based chatbot and AI agent systems, data processing pipelines and system integrations.

I have hands-on experience setting up PII masking, read-only database security and Prometheus/Grafana-based observability layers in production environments. Using Python, REST APIs, SQL and Elasticsearch, I integrate AI-powered systems into real business processes and focus on building secure, scalable and maintainable products.

Role
AI Engineer · Computer Engineer
Location
Başakşehir / İstanbul, Türkiye
  • Large Language Models (LLM)
  • Retrieval-Augmented Generation (RAG)
  • AI Agent Architectures
  • Embedding & Vector Search
  • Speech-to-Text (Whisper)
  • AI Chatbot Development
  • Prompt Engineering
  • Python
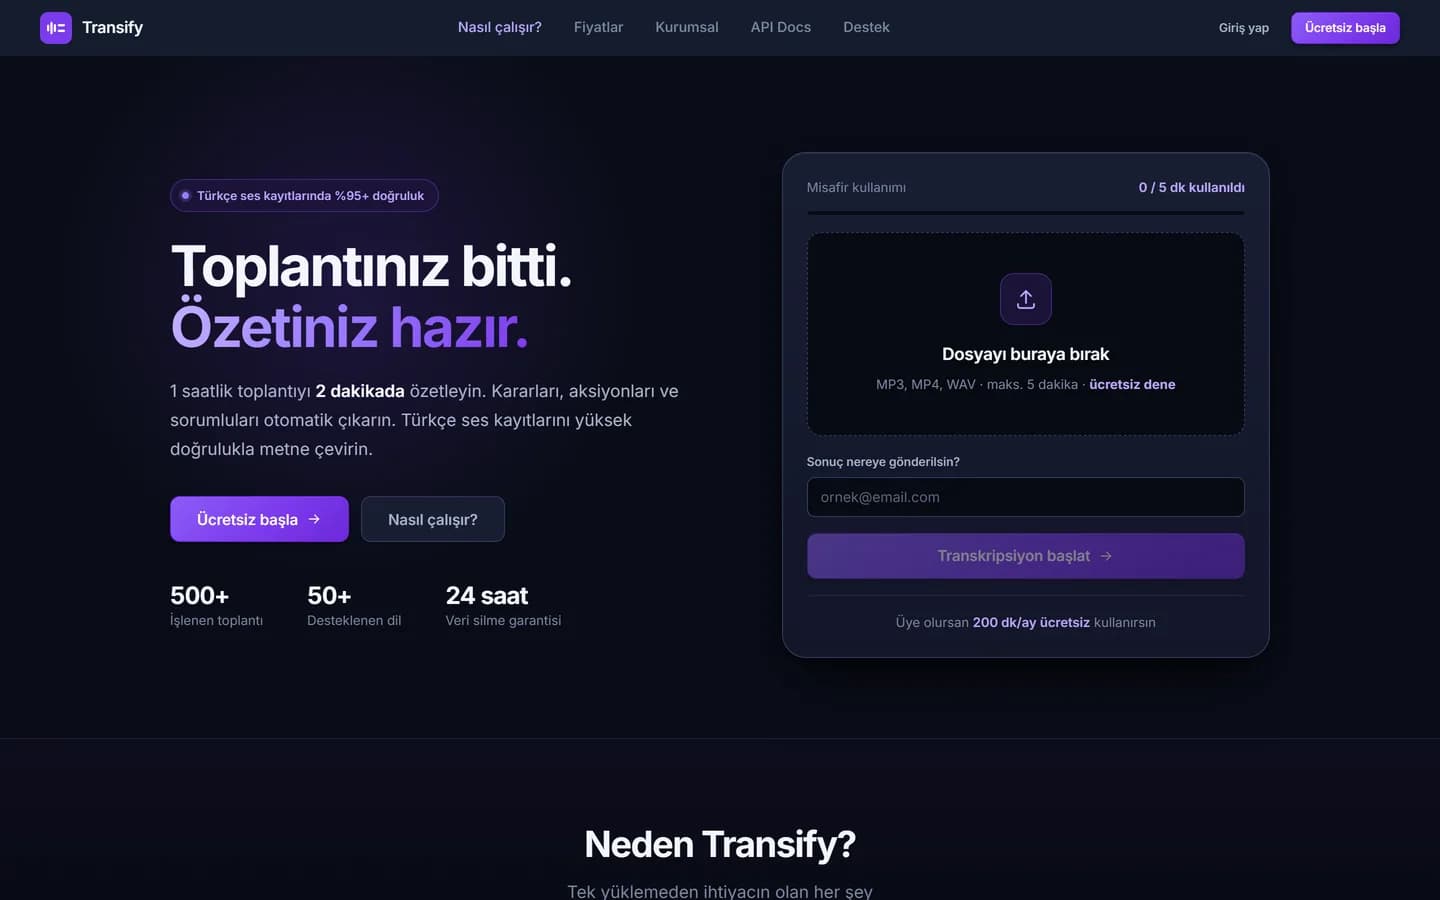
Meetings processed on Transify
500+
Languages supported
50+
Turkish transcription accuracy
95%+
Chatbot regression tests
107

Projects

Ask Göktuğ — Portfolio RAG Assistant
Transify

keep scrolling · click

01 / 07

Résumé

Muhammed Göktuğ Temiz

AI Engineer · Computer Engineer

Experience

2026 · January – Present
AI Engineer · Telpass İletişim Hizmetleri A.Ş.

Developed AI-based data processing, analysis and automation pipelines, optimising data collection, processing and reporting workflows. Built LLM integrations, AI agent architectures and enterprise AI chatbot solutions, enabling data enrichment, classification and business process automation. Developed REST API integrations, data processing services and inter-service communication components in Python. Designed API-based workflows and automations with n8n that connect different systems. Carried out data modelling, SQL optimisation and data management on MySQL and MariaDB. Built data search, indexing and filtering infrastructure with Elasticsearch. Set up server, application and service monitoring with Prometheus, Grafana and Zabbix, including performance tracking, alerting and observability dashboards. Contributed to managing and monitoring systems on Linux/Debian, Proxmox and container-based infrastructure.

2025 · April – May
Backend Developer (Intern) · Türkiye Finans Katılım Bankası

Supported software development within the Credit Card Payment Systems department. Contributed to data analysis, SQL query optimisation and reporting on Microsoft SQL Server. Gained experience with service integrations and layered architecture in C#/.NET enterprise applications.

2023 · July – August
.NET Developer (Intern) · Memoria Bilişim ve Medya A.Ş.

Built a blog platform with user and content management features using ASP.NET MVC, SQL Server and Entity Framework. Designed the application structure with a layered architecture and implemented database management and CRUD operations.

Education

2020 – 2025
BSc Computer Engineering · Giresun University

Bachelor's degree, Faculty of Engineering, Department of Computer Engineering.

Certificate
Cisco 1 – Computer Networking Fundamentals · Başakşehir Living Lab

Certificate of participation.

Skills

  • Large Language Models (LLM)
  • Retrieval-Augmented Generation (RAG)
  • AI Agent Architectures
  • Embedding & Vector Search
  • Speech-to-Text (Whisper)
  • AI Chatbot Development
  • Prompt Engineering
  • Python
  • Data Processing & Automation
  • REST API
  • API Integrations
  • Flask
  • n8n
  • Microsoft SQL Server
  • MySQL / MariaDB
  • Elasticsearch
  • ELK Stack (Elasticsearch, Logstash, Kibana)
  • SQL Optimisation
  • Data Modelling
  • Linux / Debian
  • Proxmox
  • Zabbix
  • Prometheus
  • Grafana

Languages

  • English — B1
web version →Download CV (EN)View CV ↗

Contact

Got something in mind?

If you want to talk about AI, data systems or automation work, drop me a line — I usually reply the same day.

goktugtemiz60@gmail.com
  • GitHub ↗
  • LinkedIn ↗
  • WhatsApp ↗